Calculus 101
If your experience was anything like mine, then by the time you got through with the 5 step rule, you were completely confused. That was about the time you dropped calculus and changed your major from engineering to business. Contrary to what you may think, calculus does come in handy at times, and can help give you a better understanding of the cam profile curves: lift, velocity, acceleration and jerk. I'm going to try to net out some of the basic concepts and the relationships between the curves.

 Shown
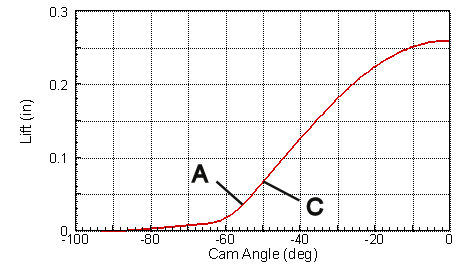
to the right and below are annotated curves for lift, velocity and
acceleration. We'll first discuss the relationship between the
lift and velocity curves. Velocity is the derivative (slope)
of the lift curve. You will notice the maximum slope of the
lift curve at point C coincides with the maximum velocity. The
lift curve has
 no
slope and the velocity is zero at the nose (zero degrees).
This relationship should be easy enough to understand. Now,
what is a bit more complicated is that the values on the lift curve
are equal to the cumulative area under the velocity curve. The
area A (marked in green) is equal to the value of lift at point A on
the lift curve. The total area under the velocity curve is
equal to the total lift.
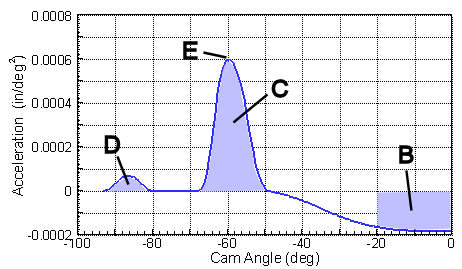
The relationship between the velocity and acceleration curves are similar. Acceleration is the derivative (slope) of velocity. The slope of velocity and the acceleration have a maximum at E. The area relationship is also the same. For example the area D is equal to the ramp velocity. Area D and C equal the maximum velocity. Area B equals the velocity at B. The negative accelerations result in negative areas. Since the velocity curve starts and ends at zero, the total of the positive and negative areas must be equal.
We have not presented a graph for jerk. It is the derivative (slope) of acceleration and the cumulative area under the jerk curve is equal to acceleration.
These relationships formed the basis for graphical lobe design methods, which were popular before computer designs were possible. With graphical methods these curves were drawn on large scale. Starting with the acceleration curve, the designer carefully balanced the negative and positive acceleration areas and insured the maximum velocity was satisfactory. The acceleration curve could then be integrated (i.e. area determined) to obtain velocity. The cumulative area under the velocity curve could then be calculated to get the lift curve.