What Wrong with Area Under Lift Curve?
 A
popular method for measuring the quality of a cam profile is the
area under the lift curve. I have frequently heard the
statement, "All that matters is the area under the lift curve."
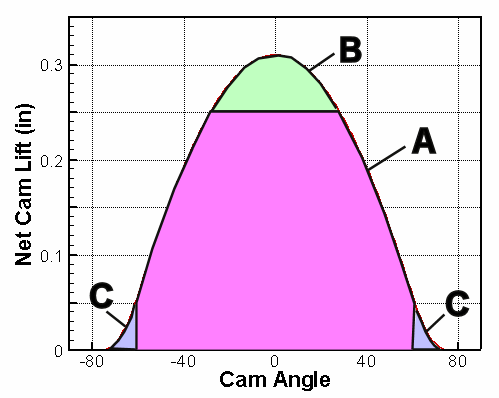
This simply is not true. The graph at the right shows a lift
curve, with three different areas indicated. The area
indicated by A is the heart of the lift event and the area here is
very important, therefore it should be counted as 100%.
First, note that the graph give net cam lift. This removes the effects of valve lash.
Suppose this cam is used with a rocker ratio, so the net valve lift wll be greater than 0.450. As the valve is first opened, the flow increases rapidly, but as the valve opening become large, say 0.300 to 0.400, the flow begins to diminish. Usually, you will get very little additional flow by increasing the valve lift above 0.500. For this reason, the area indicated by B should not count as much as that in area A. We might give area B a weight of only 50%. It is not detrimental, but it does not improve the profile to the same extent as the area at lower lifts.
The Cam Performance page discusses the importance of a quick opening and closing cam. A slow opening and closing cam, i.e. one with a large area C, will be a poor performer. It will have poor idle quality and poor off idle performance. For this reason, the area C should count against the quality of the profile, i.e. it should have a negative weighting.
In summary, area under the lift curve is not the best way to measure the quality of a cam profile. It should be used with caution. It would be better to use a weighting factor for the various portions of the curve, i.e. a weight of 1 for area A, a weight less than 1 for area B and a large negative weight for area C. Our Opticam™ Design software uses this idea for measuring cam quality.